Behavioral Finance
Loss aversion, recency and overconfidence cost investors more than fees do. The biases that show up in real portfolios, and the rules that blunt them.

Behavioral Finance
US large-company shares have returned about 10% a year over the long run. The average investor in US equity funds earned closer to 6.5%. Nothing was stolen and no fee explains the gap. The money went missing in the space between what the fund did and what the person holding it did next.
That gap has a name — the behavior gap — and it is the most expensive thing most portfolios carry.
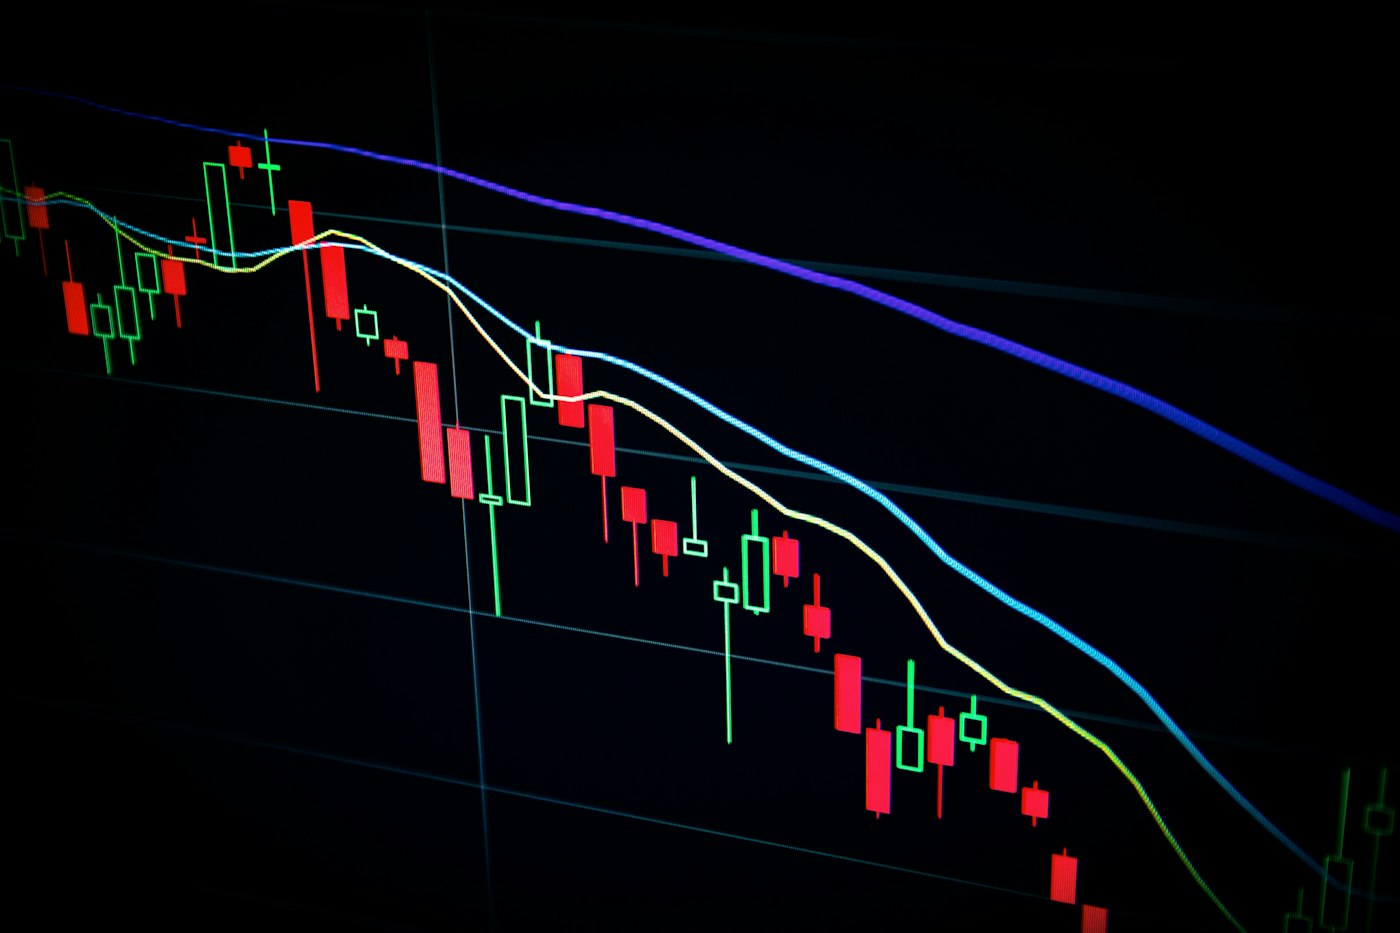
Why the gap exists
Traditional finance models a rational actor who holds a diversified portfolio, rebalances, and ignores the news. Behavioral finance starts from what people actually do, and the research is uncomfortable:
- The behavior gap. Morningstar's regular study of investor returns finds that fund investors consistently earn less than the funds they own, because money flows in after good performance and out after bad.
- Checking the portfolio too often. In a 1995 paper, Shlomo Benartzi and Richard Thaler showed that the more frequently you evaluate a volatile portfolio, the more short-term losses you see, and the less risk you are willing to hold. Myopic loss aversion is the technical term. It is why frequent checkers end up in cash.
- Trading actively. Terrance Odean and Brad Barber found that the most active fifth of retail accounts earned 11.4% a year while the market returned 17.9% over the same period. The trading itself was the cost.
- Speculating on short-term moves. A 2019 study of Brazilian day-trading learners by Fernando Chague and Bruno Giovannetti found that 97% of those who persisted beyond 300 sessions lost money. The rare winners earned less than minimum wage.
Put those together and the pattern is simple: the portfolio is rarely the problem. The interventions are.
The biases that do the damage
Loss aversion. Losing $1,000 hurts roughly twice as much as gaining $1,000 feels good, a ratio Amos Tversky and Daniel Kahneman established in the 1970s. In practice it makes people sell at the bottom to stop the pain and hold losers too long to avoid admitting the loss. In March 2020 the MSCI World fell about 34% in a single month; it had fully recovered by August. Anyone who sold in March converted a temporary drawdown into a permanent one.
Anchoring. You fasten on a number that has no predictive value and then treat it as information. "I won't buy the ETF at $95 because it was $80 six months ago" is anchoring. So is refusing to sell a position because you paid more for it. The price you paid is a fact about the past and says nothing about the next ten years.
Herd behavior. Buying because everyone is buying has an obvious social payoff and an obvious financial cost. GameStop traded near $17 in early January 2021 and above $400 three weeks later; buyers who arrived in the last days lost 70% to 90% within a month. The crowd is not wrong most of the time. It is reliably wrong at the extremes, which is exactly where it is most visible.
Confirmation bias. After buying, people read the bull case, join the forum that agrees, and file every counterargument under bad faith. The test is cheap: before you invest, write down three strong reasons the idea is wrong. If you cannot produce three, you have not researched the investment, you have joined it.
FOMO. Bitcoin ran from roughly $9,000 in early 2020 to $58,000 in early 2021, and people who bought because they could not stand watching any longer bought late. By late 2022 it traded near $13,500, and the regret was proportional to the size of the position taken at the top. Every bubble on record — Dutch tulips, dot-com shares, US housing, crypto — needed the same two ingredients: a rising price and an audience watching it.
Recency bias. Recent returns are the worst available predictor of future returns. Investors in late 2021 who concluded that technology shares only go up met a 33% Nasdaq decline in 2022. Investors who concluded in 2009 that shares were finished missed the longest bull market on record.
Overconfidence. Men, on average, trade more than women and earn less for it — that is the headline from Barber and Odean's 2001 study of 35,000 brokerage accounts. The mechanism generalises: a few early wins feel like skill, skill justifies bigger positions, and bigger positions in single names is how a portfolio ends up concentrated in the one company whose story you love.
What actually protects you
None of these biases respond to being told about them. Knowing that you are loss averse does not make you less loss averse. The fix is procedural: decide the rules while you are calm, then make it hard to break them while you are not.

Automate the investing. A standing order on a fixed date removes the timing decision, which removes most of the opportunities for a bias to act. Investors who automate do not need to be disciplined in the moment, because the moment never arises.
Automate the rebalancing, or do it on one fixed date a year. Rebalancing is selling what has just risen, which feels wrong every single time. A calendar entry does it without consulting your feelings.
Write the policy down. One page, in the second person, specific enough to be checkable: how much goes in each month, the allocation, the number of times a year you look, and what you will not do. Vague intentions do not survive a 5% down day.
Reduce the input. Delete the trading apps from your phone. Turn off price notifications. Check the portfolio monthly at most — the Benartzi and Thaler result says that how often you look changes what you are willing to hold.
Use the 72-hour rule. Any decision driven by a headline gets three days and one reread of your policy before it happens. Urgency is the tell: if a change must happen today, the reason is almost never the market.
A useful reality check
If you trade more than a buy-and-hold index investor, the arithmetic is not subtle. Put $10,000 to work for twenty-five years. At 10% a year it becomes $108,347. At 6.5% — roughly the historical gap between market return and investor return — it becomes $48,277. The sixty thousand dollars in between is not a market event.
- Market return, 10%
- Typical investor, 6.5%
The two lines diverge in a straight line, which is how compounding always looks before it looks dramatic.
Illustrative. A single $10,000 investment compounded annually at a constant rate, no fees or taxes. The 6.5% line applies the historical behavior gap to the 10% market return.
The one bias worth keeping
Not every bias is a liability. The disposition to leave a working system alone, which most people call laziness, is worth more here than any amount of financial curiosity. Investors who describe themselves as having forgotten about their accounts tend to report better outcomes than the ones who check daily, and there is nothing mysterious about why: the first group never sold at the bottom. The ideal amount of attention to pay your portfolio is enough to fund it and not quite enough to have opinions about it.
Where this stops being useful
Behavioral finance is not an argument that all advice is worthless, and it is not a licence to be fatalistic about your own decisions. Two groups should ignore most of this article. If you are carrying credit card debt above roughly 20% APR, the guaranteed 20% return from repayment beats any portfolio decision you could make, and no behavioral reframing changes that. And if you hold meaningful money in a single company's shares — often the employer's — diversification is the larger issue; self-knowledge will not diversify a concentrated position. For everyone else holding a diversified portfolio and wondering whether to sell before the next drop: you have identified the threat correctly, and it is not the market.
56 more deep dives are in the Navigator library.


